Your advantages with searchit
Savings in working time
Cost efficiency
Productivity increase
Knowledge Management
The most important advantages & functions of the Data Visualization plugin at a glance
Discover the advantages of our Data Visualization plugin:
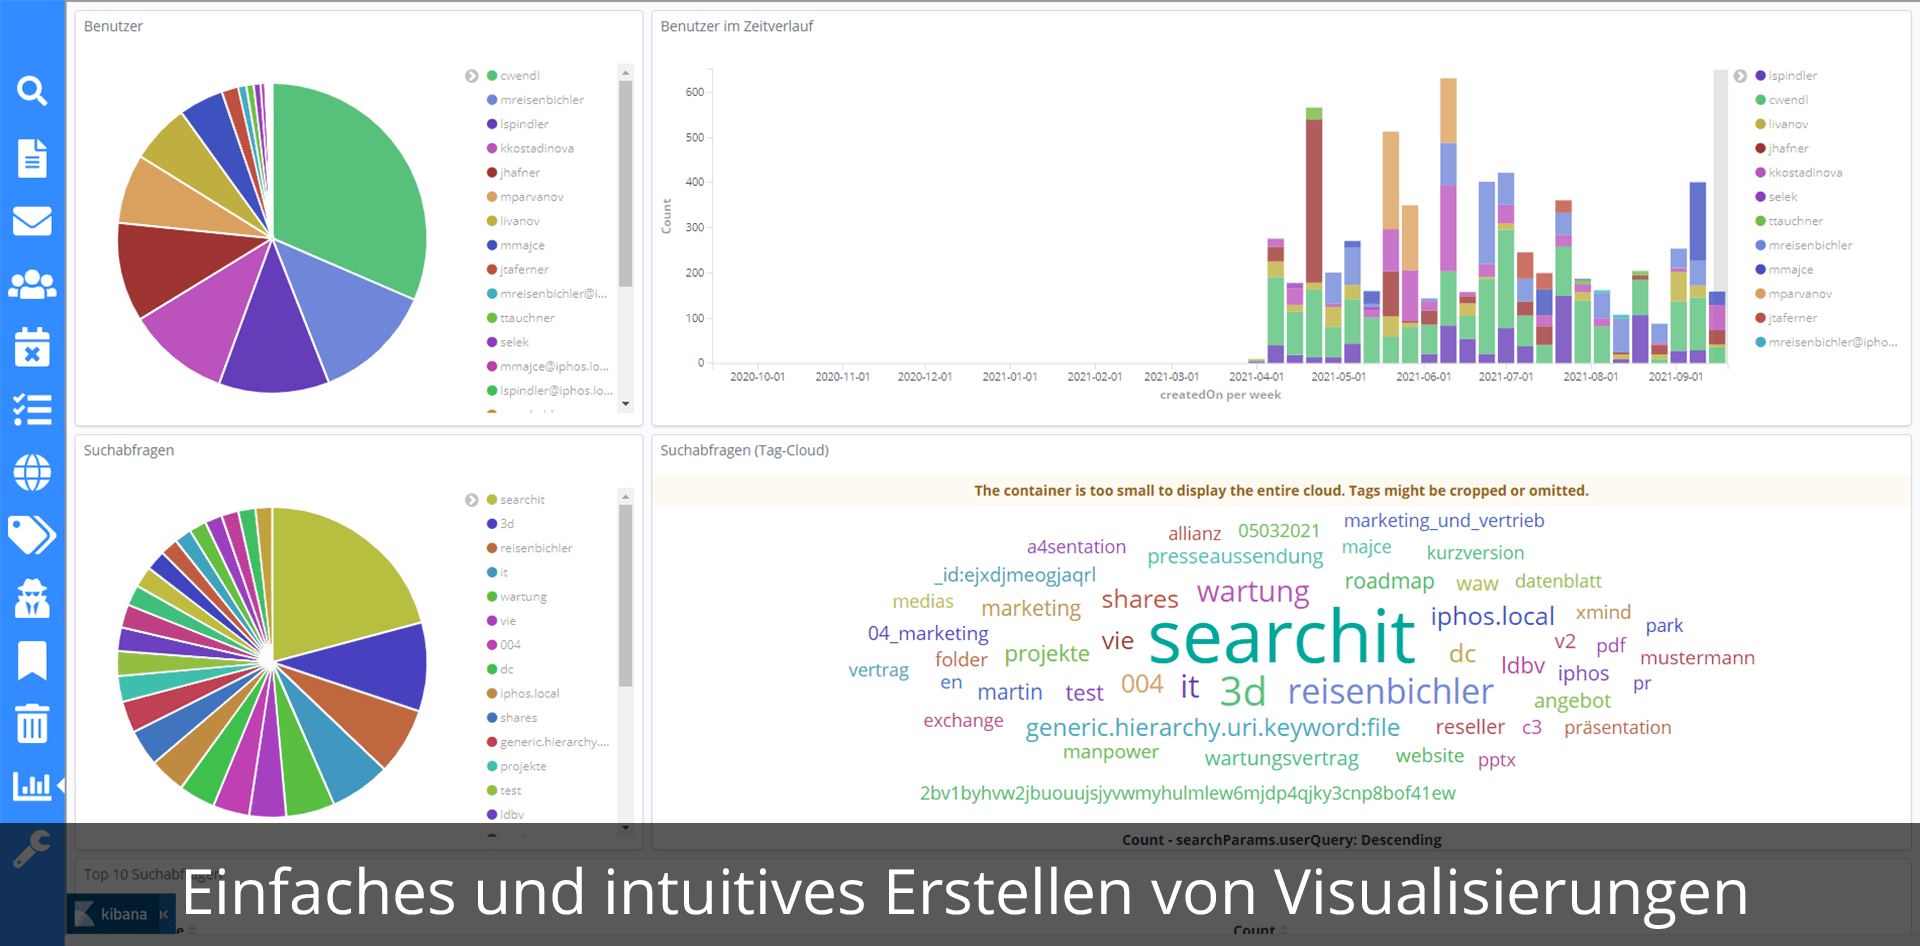
Professional, intuitive and meaningful visualization
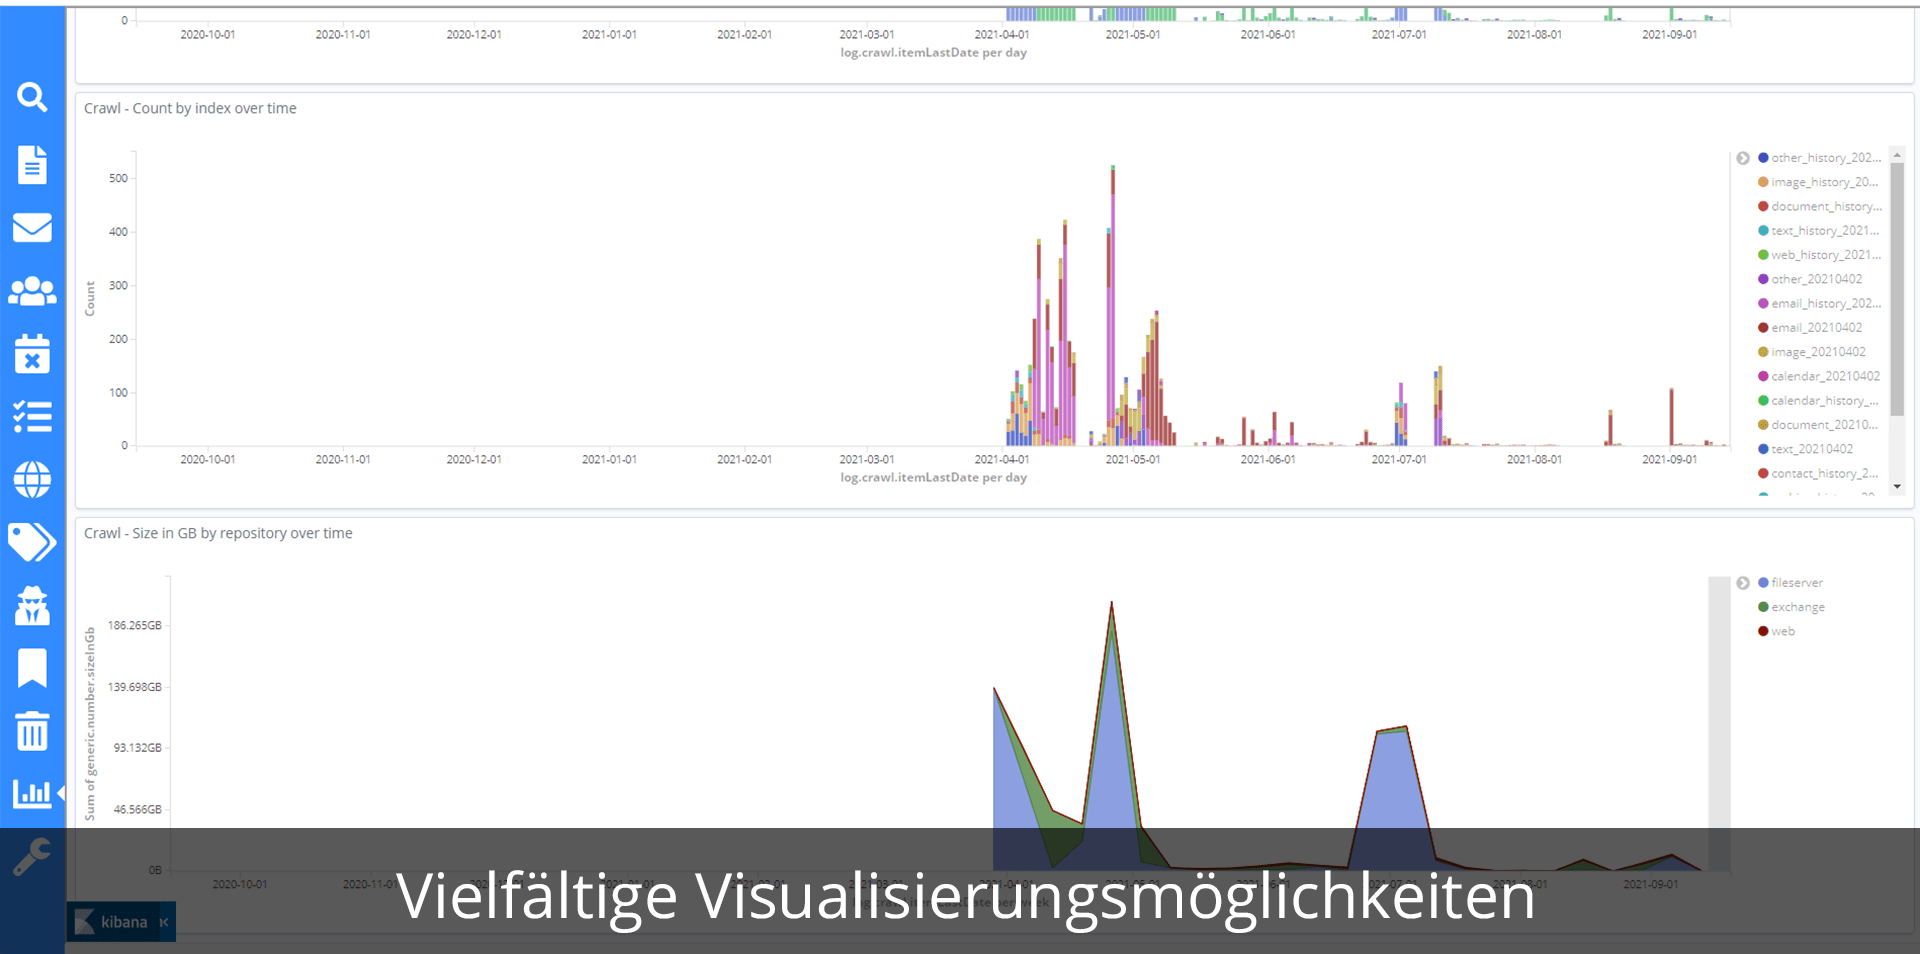
Versatile visualization options
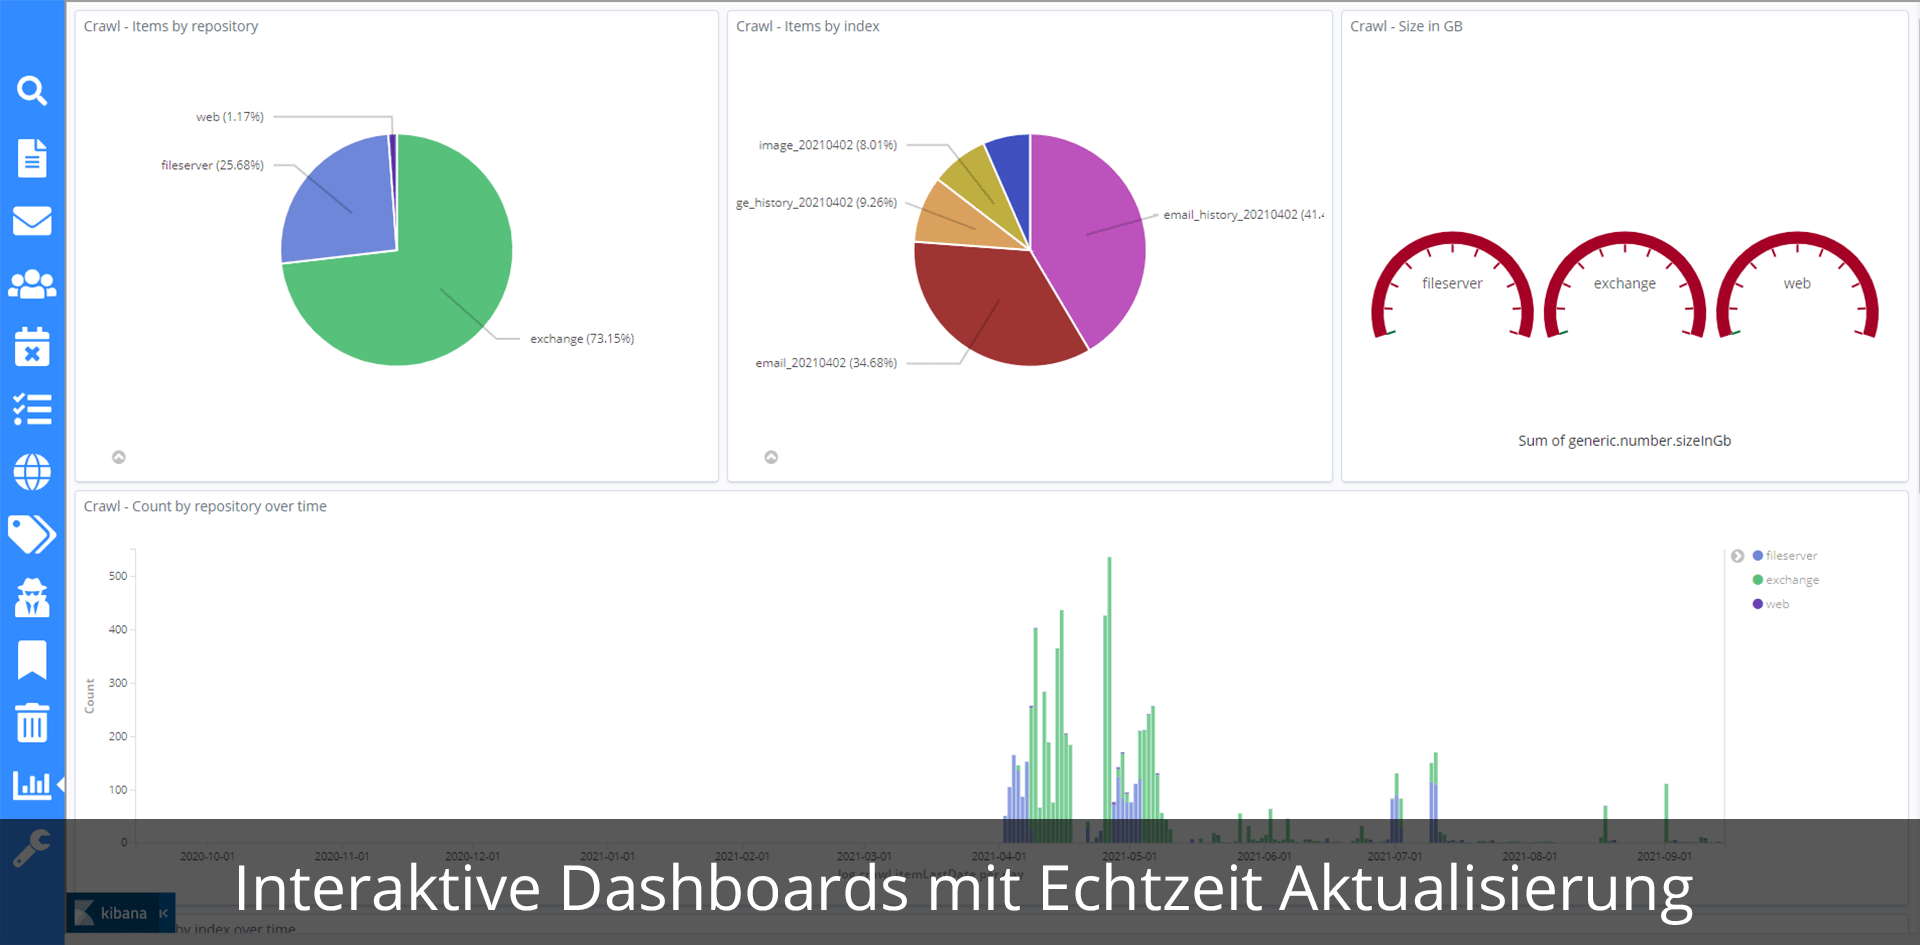
Interactive dashboards with real-time updates
Ad hoc evaluations via structured and full-text filters
Process & visualize huge amounts of data
Creation of graphics with dynamic filters similar to Excel pivot function
Cross-source and structure-independent
Visualize data beautifully & securely
Create interactive dashboards using graphics

Application examples
Surveillance & monitoring
Evaluation of search queries
Business Analytics
Business development & sales
Monitor support requests
Project Management & Controlling
Data visualization made easy
The most important advantages & best functions
at a glance.

Professional, intuitive and meaningful visualization
With searchit ‘s data visualization, you can see in just a few moments what information and correlations your data contains. Your data is condensed and important trends are presented in an understandable way so that the target audience can recognize developments and draw comparisons.

Versatile visualization options
Interactive reports, charts, graphs and more bring your business data to life. With searchit, you get smart suggestions for alternative ways to visualize your data so you can focus on what’s really important: Telling your story

Interactive dashboards with real-time updates
Your dashboards only show you the visualizations and search results that are relevant to you. You can combine several data views for more comprehensive insights, arrange them freely and edit them. The interactive dashboards allow you to bring clarity to your data. The real-time updating of the data also keeps you up to date at all times.

Ad hoc evaluations via structured and full-text filters
Ad hoc analyses help you to quickly evaluate your company data. With interactive graphical filters from searchit you can narrow down and refine your search even further, e.g. to find specific expert knowledge on certain issues. With searchit, you can search content from different data sources and thus create different dashboards for further monitoring.

Process & visualize huge amounts of data
With searchit, there are no limits to your imagination. Our search solution makes it possible to process and visualize millions of pieces of data. This makes large amounts of data tangible and understandable, while facilitating an understanding of the context of patterns, disparities and relationships. Our goal is to accompany you every step of the way to success. Which is why searchit is highly scalable and grows with your business.

Creation of graphics with dynamic filters
With searchit ‘s dynamic filters, you can create interactive graphics that make it easier to quickly summarize and analyze large amounts of data. You can filter, sort, group and conditionally format the most useful and interesting subsets of data so you can focus on the information you want.

Cross-source & structure-independent
searchit links a wide variety of sources and allows you to visualize data in real time, regardless of the data source in which it is stored. Our solution is suitable for every company, which is why searchit works perfectly regardless of your structure. Because your success is what matters to us.

Visualize data beautifully & securely
With searchit you have full control over your data. Role-based access control allows you to give certain users access to certain content and features, while others remain invisible to them. Summarize your dashboards and visualizations beautifully and securely with searchit.

Create interactive dashboards using graphics
searchit‘s data visualization plugin allows you to create interactive dashboards using various graphics. You only add data and information that is important and relevant to you. The graphical form of presentation aims at making it easier for you to gain knowledge from your data and promote decision-making.

Contact us
We focus on holistic service & a high-end enterprise search engine. Please contact us.